North Scottsdale Home Sales and Custom Lot Data
North Scottsdale Home and Custom Lot Sales Data
North Scottsdale home sales data and custom lot data, on this page, includes both homes and custom homesites, located in six North Scottsdale postal codes and one Carefree postal code; the homes in Carefree are designed and built in the same manner as North Scottsdale homes in that area. These postal codes include:
- 85254
- 85255
- 85259
- 85260
- 85262
- 85266
- 85377
Below you will find each year’s units sold and average sales price relative to size of unit whether measuring for homes or for lots. Each year is a clickable link and will take you to that year’s sales page where you can view ALL the units that sold, their mls number, subdivision name, size of unit, year build when applicable, list price, sale price and days on market.
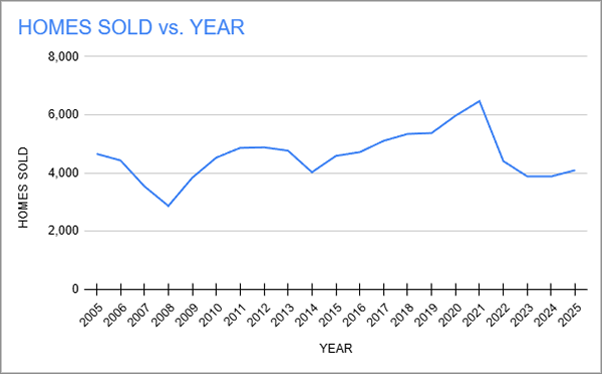
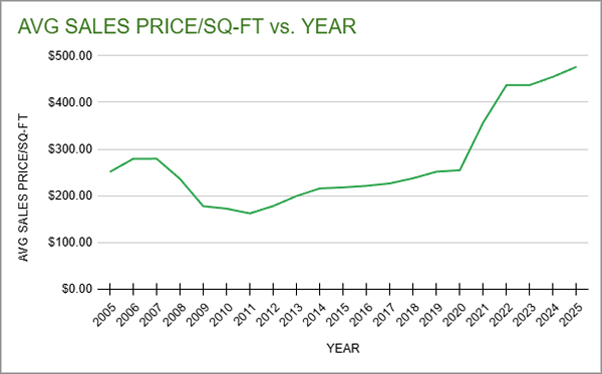
North Scottsdale Homes Sold Data
| Year | Units Sold | Ave Sales Price (Sq Ft) | |
| 2025 | 4,095 | $476.19 | Click to View |
| 2024 | 3,881 | $455.03 | Click to View |
| 2023 | 3,881 | $437.24 | Click to View |
| 2022 | 4,407 | $437.01 | Click to View |
| 2021 | 6,470 | $356.75 | Click to View |
| 2020 | 5,967 | $254.69 | Click to View |
| 2019 | 5,373 | $251.67 | Click to View |
| 2018 | 5,343 | $237.61 | Click to View |
| 2017 | 5,107 | $226.48 | Click to View |
| 2016 | 4,717 | $221.23 | Click to View |
| 2015 | 4,587 | $217.94 | Click to View |
| 2014 | 4,026 | $215.75 | Click to View |
| 2013 | 4,767 | $199.45 | Click to View |
| 2012 | 4,881 | $177.92 | Click to View |
| 2011 | 4,863 | $162.15 | Click to View |
| 2010 | 4,526 | $172.35 | Click to View |
| 2009 | 3,837 | $177.64 | Click to View |
| 2008 | 2,866 | $236.37 | Click to View |
| 2007 | 3,540 | $279.45 | Click to View |
| 2006 | 4,431 | $279.30 | Click to View |
| 2005 | 4,658 | $251.31 | Click to View |
North Scottsdale Homes Sold Charts
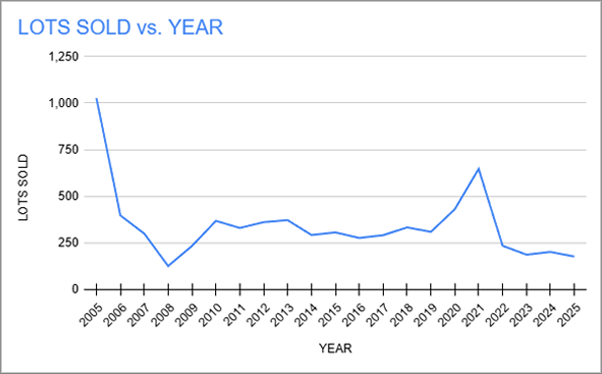
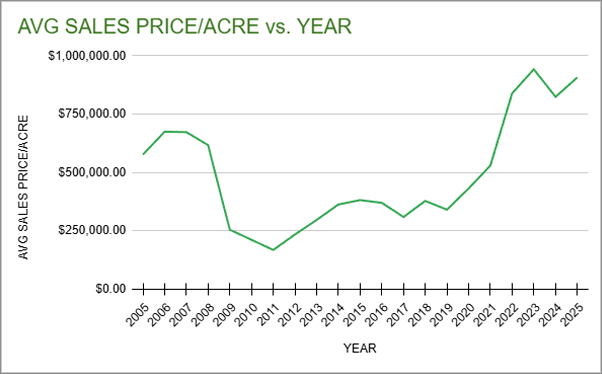
North Scottsdale Custom Lots Sold Data
| Year | Units Sold | Ave Sales Price (Acre) | |
| 2025 | 176 | $907,022.21 | Click to View |
| 2024 | 201 | $823,812.29 | Click to View |
| 2023 | 186 | $941,875.83 | Click to View |
| 2022 | 234 | $838,706.10 | Click to View |
| 2021 | 647 | $529,781.25 | Click to View |
| 2020 | 431 | $431,367.29 | Click to View |
| 2019 | 309 | $340,433.42 | Click to View |
| 2018 | 333 | $377,948.15 | Click to View |
| 2017 | 291 | $308,743.21 | Click to View |
| 2016 | 276 | $369,688.42 | Click to View |
| 2015 | 306 | $381,380.44 | Click to View |
| 2014 | 292 | $362,571.36 | Click to View |
| 2013 | 372 | $296,572.96 | Click to View |
| 2012 | 361 | $233,921.15 | Click to View |
| 2011 | 330 | $168,006.86 | Click to View |
| 2010 | 368 | $211,170.32 | Click to View |
| 2009 | 233 | $254,533.19 | Click to View |
| 2008 | 125 | $616,947.86 | Click to View |
| 2007 | 300 | $672,510.64 | Click to View |
| 2006 | 397 | $674,523.67 | Click to View |
| 2005 | 1,028 | $576,423.83 | Click to View |
North Scottsdale Custom Lots Sold Charts
Give Us a Call
Contact our team of inVIVO realty Arizona realtors today with any questions or comments relating to North Scottsdale home sales data, North Scottsdale custom lot sales data, or any other real estate in North Scottsdale.
Contact Us!
May 2026 Home Sales
McCormick Ranch Homes
Homes Closed: 87 
Avg List Price ($/SF): $475.30 
Avg Sale Price ($/SF): $457.62
Avg Days on Market: 94
Moon Valley Homes
Homes Closed: 19
Avg List Price ($/SF): $320.11
Avg Sale Price ($/SF): $313.46
Avg Days on Market: 45
Desert Ridge Homes
Homes Closed: 39
Avg List Price ($/SF): $315.87
Avg Sale Price ($/SF): $306.98
Avg Days on Market: 85
Aviano Desert Ridge Homes
Homes Closed: 7
Avg List Price ($/SF): $315.21
Avg Sale Price ($/SF): $297.53
Avg Days on Market: 83
Fireside Desert Ridge Homes
Homes Closed: 2
Avg List Price ($/SF): $295.50
Avg Sale Price ($/SF): $287.38
Avg Days on Market: 121
Annual 2025 Home Sales
McCormick Ranch Homes
Homes Closed: 799
Avg List Price ($/SF): $450.47
Avg Sale Price ($/SF): $435.71
Avg Days on Market: 74
Moon Valley Homes
Homes Closed: 377
Avg List Price ($/SF): $312.06
Avg Sale Price ($/SF): $303.50
Avg Days on Market: 71
Desert Ridge Homes
Homes Closed: 462
Avg List Price ($/SF): $372.24
Avg Sale Price ($/SF): $363.31
Avg Days on Market: 67
Aviano Desert Ridge Homes
Homes Closed: 58
Avg List Price ($/SF): $334.57
Avg Sale Price ($/SF): $325.27
Avg Days on Market: 69
Fireside Desert Ridge Homes
Homes Closed: 27
Avg List Price ($/SF): $337.26
Avg Sale Price ($/SF): $327.92
Avg Days on Market: 68